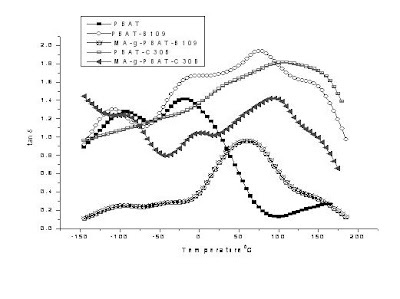
 The primary dispersion peak is due to the motion of the polybutylene adipate unit whereas the secondary peaks corresponding to terephthalate unit. Hence, Tg of the virgin corresponds to the low temperature transition of Tanδ at -20°C. It is evident that incorporation of the nanoclays result in increase in the glass transition temperature of the matrix from -20°C to -13°C. Further, the grafted sample showed an additional shift in Tg to a comparatively higher temperature -12.03°C and -11.39°C MA-g-PBAT/C30B and MA-g-PBAT/B109 respectively. This indicates an enhancement of interfacial adhesion between the filler and the biopolymer due to the segmental immobilization of polymer chains in the presence of fillers as well as improved dispersion characteristics due to exfoliation of the clay galleries. The secondary transition peak corresponding to the terephthalate unit of the biopolymer also shifted to higher temperature regions in both ungrafted and grafted nanocomposite hybrids.
Wednesday, August 27, 2008
Damping factor - Project1
5.2. Damping factor (Tanδ)
 The primary dispersion peak is due to the motion of the polybutylene adipate unit whereas the secondary peaks corresponding to terephthalate unit. Hence, Tg of the virgin corresponds to the low temperature transition of Tanδ at -20°C. It is evident that incorporation of the nanoclays result in increase in the glass transition temperature of the matrix from -20°C to -13°C. Further, the grafted sample showed an additional shift in Tg to a comparatively higher temperature -12.03°C and -11.39°C MA-g-PBAT/C30B and MA-g-PBAT/B109 respectively. This indicates an enhancement of interfacial adhesion between the filler and the biopolymer due to the segmental immobilization of polymer chains in the presence of fillers as well as improved dispersion characteristics due to exfoliation of the clay galleries. The secondary transition peak corresponding to the terephthalate unit of the biopolymer also shifted to higher temperature regions in both ungrafted and grafted nanocomposite hybrids.
The primary dispersion peak is due to the motion of the polybutylene adipate unit whereas the secondary peaks corresponding to terephthalate unit. Hence, Tg of the virgin corresponds to the low temperature transition of Tanδ at -20°C. It is evident that incorporation of the nanoclays result in increase in the glass transition temperature of the matrix from -20°C to -13°C. Further, the grafted sample showed an additional shift in Tg to a comparatively higher temperature -12.03°C and -11.39°C MA-g-PBAT/C30B and MA-g-PBAT/B109 respectively. This indicates an enhancement of interfacial adhesion between the filler and the biopolymer due to the segmental immobilization of polymer chains in the presence of fillers as well as improved dispersion characteristics due to exfoliation of the clay galleries. The secondary transition peak corresponding to the terephthalate unit of the biopolymer also shifted to higher temperature regions in both ungrafted and grafted nanocomposite hybrids.DMA - Poject1
5. Dynamic Mechanical Analysis (DMA)
5.1. Storage Modulus (E’)
The storage modulus verses temperature of the virgin matrix and nanocomposite hybrid is represented in figure 4a.
Figure 4a: Storage modulus for PBAT and its Bio-nanocomposite

It is evident that storage modulus of PBAT biopolymer increases with incorporation of nanofiller which is probably due to the efficient stress transfer from the filler to matrix. Further the grafted sample exhibited improved modulus as compared with the ungrafted nanocomposite hybrids. This further confirms improved interface between the nanofiller and the biopolymer matrix upon functionalisation with MA. MA-g-PBAT/B109 sample exhibited optimum storage modulus as compared with MA-g-PBAT/C30B nanocomposite hybrid, which is probably due to better exfoliated structure. In all the samples storage modulus (E’) decreases with the increase in temperature and there is a drastic fall in the modulus beyond –20°C, which possibly corresponds to Tg of the Biopolymer. However in case of the nanocomposite hybrid the rate of fall of matrix modulus has been compensated by the interactions caused due to the presence of the nanoclays in the system which further shows an increase in the thermal stability of biopolymer with the addition of layered silicate.
FTIR- Project1
4.3. Fourier transformation infrared spectroscopy (FTIR)
FTIR spectra of PBAT biopolymer is depicted in figure 3.
Figure 3: FTIR analysis for PBAT and its Bio-nanocomposite; (a). MA-g-PBAT-C20A, (b). MA-g-PBAT-C30B, (c). MA-g-PBAT-B109


It is evident that the peaks around 3000 cm-1 represent C-H stretching corresponding to aliphatic and aromatic portion. The carbonyl groups (>C=O) in ester linkage presented a strong peak around 1710 cm-1 with a sharp peak representing four or more adjacent –CH2- groups at 720 cm-1. The C-O bond in the ester linkage was observed around 1267 cm-1. Bending peaks of benzene substitute were located at 700 cm-1 and 900 cm-1 respectively. The bio-nanocomposite hybrids exhibited similar stretching peaks of PBAT backbone.
In case of MA-g-PBAT/C30B nanocomposites hybrid, spectral band corresponding to 1727 cm1 is probably due >C=O stretching whereas the band at 2995 cm-1 represents the carboxylic-OH stretching. This confirms the formation of carboxylic group due to chemical reaction between
Similar stretching peaks corresponding to formation of carboxylic group was also observed in MA-g-PBAT/B109 and MA-g-PBAT/C20A at 2997 cm-1 and 2990 cm-1 respectively.
Transmission Electron Microscope - Polymer1
4.2. Transmission Electron Microscope (TEM)
The dispersion characteristics of organically modified clays within the PBAT and MA-g-PBAT matrix is represented in figure 2a to 2e.
Figure 2: TEM Images for PBAT and its Bio-nanocomposite
 (a). PBAT/C30B
  (b). PBAT/B109
(c). PBAT/C20A
 (d). MA-g-PBAT-C30B
 (e). MA-g-PBAT-B109
The intercalated clay galleries as well as stacks of agglomerated clays galleries were noticed within the PBAT matrix in case of PBAT/C20A (figure 2c), PBAT/B109 (figure2b) and PBAT/C30B (figure 2a) bio-nanocomposites. However, grafting of PBAT with MA results in improved dispersion characteristics of organically modified clays within MA-g-PBAT matrix. In case of MA-g-PBAT/B109 (figure 2e) bio-nanocomposite hybrids, smaller amount of stack platelets appear in broad and obscure regions, since the layer silicates are composed of heavier elements like aluminium, silicon, magnesium than surrounding matrix, they appear darker in bright field images. Regions of exfoliated clay galleries along with intercalated stacks were also evidenced in the TEM micrographs of MA-g-PBAT/C30B (figure 2d) and MA-g-PBAT/B109, which further confirmed improved interface due to formation of chemical/physical bonds.
Tuesday, August 26, 2008
Morphological Analysis - Project1
4. Morphological Analysis
4.1. Wide angle X-Ray Diffraction (WAXD)
The distance between the silicate galleries in the nanoclays has been studied using WAXD measurement in the range of 2q = 1 to 10°. The X-Ray patterns of Na+MMT and organically modified layered silicate C20A, C30B, B109 are depicted in figure 1a.
Figure 1a: WAXD analysis of nanoclays; (a). Na+MMT, (b). C20A, (c). C30B,
(d). B109

It is evident that the interlayer distance of d001 plane of Na+MMT increases with organic modification and varies in the following order: B109>C20A>C30B>Na+MMT. The d001 spacing was calculated from the peak position using Bragg’s law [23], nl = 2dsinq, where l = 1.54Å is the X-ray wavelength and tabulated in table 4.
Na+MMT exhibits a diffraction peak at 2q =8.025° corresponding to d001 spacing of 1.1 nm. However modified clays C20A, C30B and B109 reveals a diffraction peak around 4.00, 5.610 and 3.1750 with spacing of 2.209, 1.574 and 3.005 nm respectively. This confirms intercalation of clay layers with organic modification.
The bio-nanocomposite structure has also been characterized using WAXD patterns. Direct evidence of intercalation of polymer chains into the silicate clay galleries has been observed within the experimental range of 2q = 1 to 10°. Figure 1b shows the X-ray diffractogram of PBAT/Na+MMT nanocomposite with 3wt% of clay loading.
Figure 1b: WAXD analysis for bio-nanocomposites; (a). PBAT/C20A, (b). PBAT/C30B, (c). PBAT/B109, (d). MA-g-PBAT-C30B, (e). MA-g-PBAT-B109

It is observed that the intensity characteristic peak of Na+MMT in PBAT/Na+MMT nanocomposite shows similar angle of diffraction as that of pristine clay, which clearly indicates the confirmation of formation of a conventional composite, because there is no favorable interactions of PBAT matrix with Na+MMT. However, XRD patterns of PBAT/C20A, PBAT/C30B and PBAT/B109 bio-nanocomposite hybrids reveal a characteristic peaks, shifted to smaller diffraction angles at 2.175, 2.145 and 2.03° respectively due to intercalation of PBAT chains into the silicate galleries. The interlamellar d001-spacing follows the following order B109 (nm)> C20A (nm)> C30B (nm). This further, shows highly intercalated structure, due to strong interaction between carbonyl groups (>C=O) of PBAT with -OH groups of organoclay.
Further, the average number of clay layers forming tactoids has been calculated using Scherrer equation as
L = Kλ / β001 cosq
Where, L is average thickness clay stack, β001 (radian) is full width at half maximum for 001 reflection, and k = 0.9.
The number of clay layers per stack (N) was calculated as
N = (L/d001) + 1
Test results reported in table 4 indicates that in case of PBAT bio-nanocomposites, N was found to 1.56 – 4.58.This indicates that the clay stacks consisting of 2 – 5 platelets are dispersed in PBAT bio-nanocomposites. In case of MA-g-PBAT/30B and MA-g-PBAT/B109 bio-nanocomposite hybrids, the X-ray diffraction patterns indicate absence of deflection peak within the experimental range, which indicate exfoliation of clay galleries. This is due to the fact that MA acts as a compatibilizing reagent which penetrates into clay galleries forming chemical linkage between the anhydride group of MA and PBAT and layered silicates. The same has been also corroborated using FTIR spectroscopy. This further results in an increase in the gallery spacing allowing the polymer chains to enter and break the galleries during compounding resulting in exfoliated and improved dispersion.
Results and discussion- Mechanical Properties-Project1
3.1. Mechanical properties
3.1.1. Tensile strength
Table- 1 shows the tensile strength, tensile modulus and elongation at break of PBAT, PBAT bio-nanocomposite hybrids respectively. It is evident that incorporation of nanoclays results in an increase in the tensile modulus of matrix polymer in both transverse and as well as in machine direction respectively. Test results represented in Table-1 summarizes that the young’s modulus of PBAT virgin is 26.20 MPa in transverse direction and 30.17 MPa in machine direction respectively. Incorporation of nanoclays leads to substantial increase in the young’s modulus in both the directions. In case of the nanocomposite prepared using C30B nanoclay an increase of young’s modulus to the tune of 30.59% and 31.99% respectively was observed. This increase in the modulus is probably due to high aspect ratio of the nanoclays that results in strong interaction between PBAT matrix and nanofiller. A similar increase in young’s modulus of PBAT/B109, PBAT/C20A nanocomposite hybrids was also noticed to the tune of 38.88% 46.94%, and 14.50% 7.22% in transverse and machine direction respectively as compared with the virgin matrix. The increase in young’s modulus of virgin PBAT matrix follows the following order PBAT/B109>PBAT/C30B>PBAT/C20A> PBAT/Na+MMT.
The nanocomposite hybrid with B109 exhibited optimum performance as compared with the other nanocomposite hybrids. This behavior is probably due to the homogeneous distribution and micro dispersion of nanoclay facilitating separation of tactoids and platelets resulting in partial exfoliation and intercalation accomplished through shear stress during melt compounding. Furthermore, B109, a hectorite layered Mg silicate variant of smectite clay provides more particles per gram as well as smaller platelets thus, creating more surface area exhibiting improved performance characteristics as compared with other organically modified montmorillonites, i,e, C20A and C30B respectively.
In all the cases, the nanocomposite hybrids exhibited higher performance in the machine direction, which is probably due to the uniform alignment and improved interfacial adhesion of the nanoscale reinforcement within the PBAT matrix.
However addition of nanoclays leads to a decrease in tensile strength as well as elongation at break. This decrease can be correlated with the nanoclay content wherein more pronounced effect was observed for PBAT/Na+MMT hybrid, which further indicates lower affinity of PBAT matrix with hydrophilic Na+MMT.
The tensile properties of blown films derived from maleic anhydride grafted PBAT (MA-g-PBAT) bio-nanocomposite hybrids using various organically modified nanoclays: B109, C30B, C20A at 3wt% is depicted in table-2. It is observed that the grafted samples exhibited improved tensile modulus as compared with the ungrafted bio-nanocomposite hybrids. In case of MA-g-PBAT/C30B, an increase of 44% and 86.32 % of tensile modulus in transverse and machine direction respectively as well as marginal increase in tensile strength from 6.8 to 10.21 MPa in transverse direction and 10.78 to 15.31 MPa in machine direction were observed. This behavior is primarily due to modification of interfacial region between PBAT matrix and C30B organoclay. MA acts as a bridge forming an ester linkage with the –OH group of C30B. Furthermore, an intra molecular hydrogen bond is also formed between the carbonyl group of PBAT and hydroxyl –OH groups of MA.
A similar increase in elongation at break was also observed in both the directions. Nanocomposite hybrids of B109, C20A with MA-g-PBAT also exhibited an increase in the young’s modulus to approximately 84% and 74% in machine direction and 100%, 61% in transverse direction respectively. This is probably due to the formation of inter molecular hydrogen bonding between hydrogenated tallow groups of B109 and C20A and MA-g-PBAT matrix. However, the bio-nanocomposite hybrid prepared using B109 clay exhibited maximum young’s modulus, which can be explained due to similar cause that B109 provides increased clay platelets per surface area of contact with virgin matrix.
The existence of interfacial bonds in grafted nanocomposite hybrids system have already been corroborated using FTIR spectroscopy. In all cases the elongation at break in the transverse direction increased which is presumably assumed because of formation of chemical/physical network between the polyester chains and the organoclays, while restricting the extension of the matrix chains in the machine direction to the same extent .
3.1.2. Tear strength
The tear resistance of PBAT matrix and the bio-nanocomposite hybrids is shown in table 3. The virgin biopolymer exhibits tear strength of 335.3 g/mm. Incorporation of nanoclays results in an increase in the tear resistance of the matrix polymer. Nearly 19% increase in the tear strength of PBAT matrix was observed in PBAT/B109 bio-nanocomposite hybrid, which indicates effective stress transfer from the organically modified nanoclays to the virgin matrix. Furthermore, formation of an intercalated structure also might have contributed to an increase in the tear resistance. PBAT/C30B as well as PBAT/C20A bio-nanocomposite hybrid also exhibited an increase in tear strength of PBAT from 335.3 g/mm to 343.17 g/mm and 283.00 g/mm respectively.
Further, functionalization of PBAT matrix with MA through reactive extrusion results in modification of the interfacial region between PBAT and nanoclays through formation of covalent bonds/hydrogen bonds with suitable chemical/pendent groups. The bio-nanocomposite hybrid of MA-g-PBAT/B109 exhibited a tear resistance of 445.39gm/mm where as MA-g-PBAT/C30B exhibited a tear resistance of 375.05gm/mm respectively. Bio-nanocomposite hybrid prepared using C20A showed marginally high tear resistance as compared with virgin PBAT matrix which is probably due to less affinity of C20A clay, organically modified with methyl dihydrogenated tallow quaternary ammonium salt with the PBAT matrix. Furthermore grafted nanocomposite hybrid MA-g-PBAT/C20A also could not exhibit any appreciable change in the tear resistance.
Test Result - Tables- Poject 1
Table 1: Effect of nanoclay loading on Mechanical properties of PBAT virgin and its Bio-nanocomposite hybrids
| Samples | Tensile Modulus (Mpa) | Tensile Strength (N/mm2) | Elongation at break (%) |
| PBAT PBAT/Na+MMT PBAT/C30B3% PBAT/C20A3% PBAT/B1093% | 26.20 (T) 30.17 (M) 26.30 (T) 30.29 (M) 34.21 (T) 39.82 (M) 30.03 (T) 32.35 (M) 36.38 (T) 44.33 (M) | 20.81 (T) 14.32 (M) 6.75 (T) 5.03 (M) 6.88 (T) 10.78 (M) 3.51 (T) 4.19 (M) 5.49 (T) 17.37 (M) | 602.33 (T) 766.44 (M) 533.99 (T) 620.38 (M) 552.844 (T) 601.66 (M) 544.08 (T) 550.33 (M) 595.41 (T) 740.303(M) |
T – Transverse direction
M – Machine direction
Table 2: Effect of functionalization on Bio-nanocomposite hybrids
Samples | Tensile modulus (MPa) | Tensile strength (N/mm2) | Elongation at break (%) |
| PBAT/PBAT-g-MA/C30B PBAT/PBAT-g-MA/C20A PBAT/PBAT-g-MA/B109 | 52.489(T) 56.213(M) 43.467(T) 52.597(M) 73.123(T) 81.854(M) | 8.353(T) 12.314(M) 3.221(T) 6.391(M) 7.7952(T) 8.627(M) | 605.39(T) 684.32(M) 560.93(T) 590.39(M) 695.35(T) 760.39(M) |
T – Transverse direction
M – Machine direction
Table 3: Tear strength of PBAT virgin and its Bio-nanocomposite hybrids
| Samples | Tear strength (g/mm) |
| PBAT PBAT/C30B(3wt%) PBAT/C20A(3wt%) PBAT/B109(3wt%) PBAT/g/C30B(3wt%) PBAT/g/C20A(3wt%) PBAT/g/B109(3wt%) | 335.30 343.17 283.00 348.98 375.05 290.03 445.39 |
Table 4: WAXD of Nanoclays and Bio-nanocomposite hybrids
| Samples | Position (2q) | d-Spacing | Dd =d2 – d1 (nm) | No. of platelets/ stack |
| Na+MMT C20A C30B B109 PBAT/Na+MMT3% PBAT/C20A3% PBAT/C30B3% PBAT/B109 | 8.025 4.000 5.610 3.175 8.001 2.175 2.145 2.001 | 1.100(d1) 2.209(d1) 1.574(d1) 3.005(d1) 1.107(d2) 4.063(d2) 4.117(d2) 4.150(d2) | - - - - 0.007 2.213 1.777 1.145 | - - - - 4.3 3.2 3.3 3.0 |
| Sample | Tg °C | ∆Cp J/g | Tm °C | ∆Hf J/g | Tc °C | ∆Hc J/g | Xc % |
| PBAT PBAT/Na+MMT3% PBAT/C20A3% PBAT/C30B3% PBAT/B1093% MA/g/PBAT/C30B3% MA/g/PBAT/B1093% | -39.69 -35.48 -33.24 -27.28 -26.16 -26.31 -25.28 | 0.464 0.369 0.219 0.166 0.385 7.180 7.489 | 109.02 112.00 118.01 125.00 126.72 138.25 139.02 | 4.008 5.019 5.678 6.391 7.984 18.91 24.31 | 66.41 77.48 79.31 75.47 95.05 94.01 95.64 | -3.90 -3.94 -4.12 -5.30 -16.3 -6.29 -15.2 | 3.510 4.538 5.134 5.770 7.200 17.10 21.98 |
Table 6: TGA Analysis PBAT virgin and its Bio-nanocomposite hybrids
| Samples | Initial degradation temperature °C | Final degradation temperature °C | 50% degradation temperature °C | Ash content (%) |
| PBAT PBAT/Na+MMT3% PBAT/C20A3% PBAT/C30B 3% PBAT/B109 3% PBAT/g/C30B 3% PBAT/g/B109 3% | 310.58 311.12 315.29 322.58 326.23 322.88 339.59 | 412.00 416.25 420.59 462.24 469.24 462.58 505.82 | 405.01 406.54 410.12 414.38 421.13 418.72 419.33 | 8.13 8.03 7.95 7.32 7.41 8.12 5.05 |
DMA, TC, BT - Project1
2.6. Dynamic Mechanical Analysis (DMA)
The samples were studied using Dynamic Mechanical Thermal Analyzer (NETZSCH DMA 242, Germany), at fixed frequency of 1Hz and heating rate of 10°C/min using specimens of dimensions 25mm x 5mm x .07mm in a temperature range of –150°C to 200°C.
2.7. Thermal Characterization
The melting, crystallization and thermal stability of virgin PBAT and the nanocomposite samples have been studied using Differential Scanning Calorimetry (Perkin-Elmer Diamond DSC, USA) and Thermogravimetric Analysis (Perkin –Elmer Pyris-7 TGA, USA), respectively. The samples for DSC analysis (5-10 mg) were initially scanned from -80°C to 200°C under nitrogen atmosphere at a heating rate of 10°C/min, to erase the previous thermal history. Subsequently, the sample was held at 200°C for 5 minutes and cooled to -80°C and rescanned from -80°C to 200°C. Corresponding glass transition temperature, melting temperature, heat of fusion and crystallization temperatures were recorded.
The thermal stability of the PBAT and PBAT bio-nanocomposite hybrids was determined using TGA with samples ≤ 5mg weight, scanned from 50°C to 600°C at a heating rate of 10°C in nitrogen atmosphere. The initial and final degradation temperature and corresponding percentage weight loss for the samples were noted.
2.8. Biodegradation test
The biodegradability of the bio-nanocomposite hybrid and PBAT matrix was determined as per ASTM D 5338; by measuring the total Biological oxygen demand (BOD) in an aerobic compost medium. Rectangular samples of dimensions 2 cm x 2 cm, were taken as the specimen for biodegradation test.
2.8.1. Test procedure as per ASTM D5338
1. The test material was added to one of the three composting vessels, the second one was kept as blank with the third one as reference (cellulose) to ensure the viability of the innoculum.
2. The composting vessels (innoculum + test material / reference/ blank) are incubated in the dark and the vessel temperature was maintained at 58° C.
3. The test was started by bubbling free air (O2) in the solution at a rate of 50 to 100 ml/ min per flask for a period of 180 days (as per ASTMD 6400).
C + O2 ----------> CO2
4. The amount of CO2 produced passed through the Ba(OH)2 solution which is precipitated as BaCO3.
5. The CO2 liberated was calculated by titrating the remaining Ba(OH)2 with 0.05N HCl.
% CO2 evolved = 1.1 * ml HCl * 12* 100 /44 * y
Where
y = mg CO2 charged to flask
% Biodegradation = Mean Cg (test) – mean Cg (blank) / Ci
Where:
Cg =amount of gaseous carbon produced, g, and
Ci = Theoretical amount of carbon in test compound in the sample, g
The theoretical oxygen demand was calculated from the composition and structural formula of the PBAT copolymer with the assumption that the degraded products were completely mineralized to CO2.
Morphological studies -project1
2.5. Morphological studies
2.5.1. Wide Angle X-Ray Diffraction (WAXD)
Wide angle X-Ray diffraction (WXRD) analysis was carried out using X-Ray diffractometer (Philips X’Pert MPD,
2.5.2. Transmission Electron Microscopy (TEM)
For TEM observation, the samples were microtomed at low temperature (-55°C) using Leica Ultracut Scryo-microtome (
2.5.3. Fourier transformation infrared spectroscopy (FTIR)
FTIR spectra of virgin PBAT and MA-g-PBAT/C30B, MA-g-PBAT/B109 and MA-g-PBAT/C20A bio-nanocomposites grafted with MA were recorded using Perkin-Elmer 1720X,UK) spectrometer. Each spectrum was obtained by co-adding 64 consecutive scans with a resolution of 4 cm-1 within the range of 500 - 4000cm-1. The samples were studied using two different methods. The FTIR analysis of virgin PBAT and PBAT grafted nanocomposite hybrids were studied using KBr pallet method. A uniform and continuous film was formed on the disk until the solvent was completely evaporated.
Mechanical Tests - Project1
2.4. Mechanical Tests
2.4.1. Tensile properties
Specimens of dimension 130mm x 25mm x 0.07mm were prepared from the blown films for determining the tensile strength, tensile modulus and elongation at break as per ASTM D882 in Universal Testing Machine (UTM, Lloyds Instruments Ltd.,
2.4.2. Tear strength
Tear test for the prepared samples were performed as per ASTM D1922 in Pendulum Tear tester (ATSFAAR, Vignate MI,
EXPERIMENTAL - Project1
2. EXPERIMENTAL
2.1. Materials
PBAT with MFI 3.3- 6.6g/10min (at 190°C; 2.16 Kg); density 1.25-1.27g/cm3, melting point 110°C-115°C supplied by M/S BASF Japan Ltd was used as base matrix. Four types of nanoclays i.e Na+MMT (unmodified having CEC 92.6meq/100g clay), Cloisite 20A, (C20A, modified by 2M2HT: dimethyl, dihydrogenated tallow, quaternary ammonium having CEC of 95meq/100g clay), Cloisite 30B,( C30B,modified by MT2EtOT: methyl tallow bis-2-hydroxy ethyl quaternary ammonium salt and CEC of 90 meq / 100g clay) procured from M/S Southern clay Products Inc, USA and Bentonite (B109) obtained from M/S Elementis UK were used as nanoreinforcement to fabricate PBAT nanocomposites. Maleic anhydride (MA) and benzoyl peroxide (BPO) of analytical grade were purchased from
The organoclays and unmodified clay (Na+MMT) were dried under vacuum at 80°C for 5 hrs and the PBAT pellets were dried at 40°C for 30 minutes, prior to melt blending and fabrication of bio-nanocomposites.
2.2. Preparation of PBAT Bio-nanocomposite hybrids
The bio-nanocomposite hybrids of PBAT with various organically modified nanoclays and natural Na+MMT was prepared using melt blending technique in a co-rotating twin screw extruder (Haake rechord 9000, Germany). PBAT biopolymer was melt mixed with Na+MMT, C30B, C20A and B109 nanoclays at different weight percentage (1, 3, 5 wt%) at a temperature difference from feed to die zone between 165° C- 180°C and screw speed of 60-70 rpm.
In an attempt to improve the interfacial region between PBAT and nanoclays, maleic anhydride grafted PBAT (MA-g-PBAT) bio-nanocomposite hybrids were prepared using C30B, C20A and B109 nanoclays at 3wt% of clay loading through a two steps reactive extrusion process. In the first step, free radical grafting of PBAT using MA (3wt% by PBAT) was carried out using (BPO) (0.5wt% by PBAT) at a temperature of 165°C-180°C and screw speed of 60-80 rpm.
In the second step, MA-g-PBAT was melt blended with various organically modified nanoclays using the same optimized temperature and speed. Subsequently the extrudate was pelletized to granules.
2.3. Preparation of PBAT Bio-nanocomposite films
The extrudate pellets of various bio-nanocomposite hybrids were predried at 60°C for one hour prior to introduction into the blown film unit (Haake 9000,
Subscribe to:
Posts (Atom)

