Monday, September 1, 2008

TGA - Project1


6.2. Thermo Gravimetric analysis (TGA)

The thermal stability of virgin PBAT, PBAT bio-nanocomposite hybrids and MA-g-PBAT bio-nanocomposites are assessed employing TGA. The initial degradation temperature and temperature at 50% degradation and ash content is represented in figure 6 and table 6.

Figure 6: Thermo Gravimetric analysis (TGA) for PBAT and its Bio-nanocomposite

(a). PBAT, (b). PBAT-Na+MMT, (c). PBAT-C20A, (d). PBAT-C30B, (e). PBAT-B109, (f). MA-g-PBAT-C30B, (g). MA-g-PBAT-B109


It is evident that the thermal degradation of virgin PBAT starts at 310.58°C and 100% degradation were noticed around 412°C, whereas incorporation of organically modified nanoclays substantially increases the thermal stability of the biopolymer. PBAT/C30B nanocomposite hybrid exhibits the initial degradation temperature around 322.58°C and final degradation temperature around 469.58°C which is comparatively higher than that of virgin matrix. A similar increase in the initial and final degradation temperature of PBAT/B109 nanocomposite hybrid to 326.23°C and 469.24°C was observed. The phenomenon of increase in thermal stability of the biopolymer matrix with the addition of layered silicates is primarily due to the fact that the nanoclays act as heat barrier, thereby increasing the thermal stability of the system as well as assisting in char formation during thermal decomposition.

The grafted bio-nanocomposite hybrids exhibited a further increase in the degradation temperature. MA-g-PBAT/B109 showed maximum initial and final degradation temperature of 339.59°C and 505.82°C. The bio-nanocomoposite hybrid samples prepared using B109 nanoclay exhibited optimum thermal performance owing to its higher surface area and smaller platelets.

In case of the nanocomposite hybrid a char residue was obtained which indicated improved flammability characteristic in the system.


Thermal Characterization - Project1


6. Thermal Characterization

6.1. Differential Scanning Calorimetry (DSC)

Table 5 depicts the melting characteristics of PBAT and various nanocomposite hybrids. DSC thermogram reveals that the co-polyester presents a single transition or Tg, Tc and Tm due to repartition of different sequences. At room temperature PBAT exhibits a rubbery pleatue between Tg and Tm. The enthalpy for 100% crystalline PBAT has been calculated taking into consideration the contribution of ester group, methylene and paraphenylene groups as –2.5, 4.0 and 5.0 kJ/mol respectively. The calculated value has been determined to 114 J/g. The degree of crystallinity has been estimated using the following equation

Xc (%) = ( ∆ Hf / ∆H100% ) * ( 100 / (1-Ww) )

Where Xc = % of crystallinity

∆ Hf = Experimental melting heat of fusion

∆H100% = Heat of fusion of 100% crystalline PBAT

Ww = weight fraction of nanoclay

It is observed that ∆Cp gap at glass transition temperature is very small. The different thermodynamic value is in consistent with the data obtained by other authors.

Test results reported in table 5 and figure 5a indicates that incorporation of organically modified nanoclays result in significant increase in Tg of PBAT matrix from –35.97 to –39.69°C in case of PBAT/C30B and -27.28°C in PBAT/B109 nanocomposite hybrids respectively.

Figure 5a: Glass transition temperature (Tg) for PBAT and its Bio-nanocomposite

(a). PBAT, (b). PBAT-Na+MMT, (c). PBAT-C20A, (d). PBAT-C30B, (e). PBAT-B109, (f). MA-g-PBAT-C30B, (g). MA-g-PBAT-B109


Wherein intermolecular interactions between –OH group of C30B and carbonyl groups (>C=O) of PBAT ester functions have been reported. The presence of hydrogen bonds probably result in immobilization of polymer chains, subsequently enhancing the Tg values. Further MA-g-PBAT/C30B and MA-g-PBAT/B109 nanocomposite hybrids exhibit additionally higher Tg values of –-26.31°C and –25.28°C revealing improved interface through the formation of chemical/physical linkage.

Similarly the melting temperature of PBAT matrix (figure 5b) also showed a substantial increase from 109.2°C to 125°C in PBAT/C30B, 126.72°C in PBAT/B109, 138.25°C in MA-g-PBAT/C30B and 139.02°C in MA-g-PBAT/B109 nanocomposite hybrids respectively.

Figure 5b: Melting temperature (Tm) for PBAT and its Bio-nanocomposite

(a). PBAT, (b). PBAT-Na+MMT, (c). PBAT-C20A, (d). PBAT-C30B, (e). PBAT-B109, (f). MA-g-PBAT-C30B, (g). MA-g-PBAT-B109


The variation of crystallization temperature (Tc) of virgin matrix and nanocomposite hybrids is presented in table 5 and figure 5c.

Figure 5c: Crystallization temperature (Tc) for PBAT and its Bio-nanocomposite

(a). PBAT, (b). PBAT-Na+MMT, (c). PBAT-C20A, (d). PBAT-C30B, (e). PBAT-B109, (f). MA-g-PBAT-C30B, (g). MA-g-PBAT-B109


The virgin matrix exhibits a crystallization peak around 66.14°C which increased substantially with the incorporation of nanoclays as well as functionalization of PBAT with MA. PBAT/C30B bio-nanocomposite hybrid exhibits optimum crystallization peak around 96.45°C. This is primarily due to heterogeneous nucleation effect in presence of nanoclay which increase the nucleation sites in the polymer matrix. However, grafting of virgin matrix does not show any appreciable increase in the crystallization temperature of PBAT in the bio-nanocomposites as compared with the ungrafted bio-nanocomposites.

The melting heat of fusion of virgin matrix was noticed around 13.9 J/gm, which exhibited the marginal decrease with the incorporation of nanoclays. The degree of crystallinity of PBAT also did not show any appreciable change with addition of nanofiller as well as functionalization of polymer matrix.

Wednesday, August 27, 2008

Damping factor - Project1

5.2. Damping factor (Tanδ)

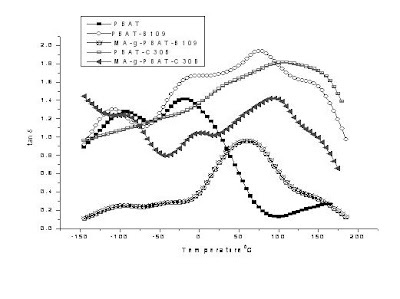
Virgin PBAT exhibits two transition peaks corresponding to a primary transition around -20°C and a secondary transition around 62°C (figure 4b).

Figure 4b: Damping factor for PBAT and its Bio-nanocomposite

Damping factorThe primary dispersion peak is due to the motion of the polybutylene adipate unit whereas the secondary peaks corresponding to terephthalate unit. Hence, Tg of the virgin corresponds to the low temperature transition of Tanδ at -20°C. It is evident that incorporation of the nanoclays result in increase in the glass transition temperature of the matrix from -20°C to -13°C. Further, the grafted sample showed an additional shift in Tg to a comparatively higher temperature -12.03°C and -11.39°C MA-g-PBAT/C30B and MA-g-PBAT/B109 respectively. This indicates an enhancement of interfacial adhesion between the filler and the biopolymer due to the segmental immobilization of polymer chains in the presence of fillers as well as improved dispersion characteristics due to exfoliation of the clay galleries. The secondary transition peak corresponding to the terephthalate unit of the biopolymer also shifted to higher temperature regions in both ungrafted and grafted nanocomposite hybrids.

DMA - Poject1

5. Dynamic Mechanical Analysis (DMA)

5.1. Storage Modulus (E’)

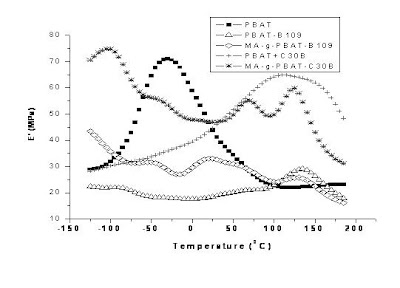
The storage modulus verses temperature of the virgin matrix and nanocomposite hybrid is represented in figure 4a.


Figure 4a: Storage modulus for PBAT and its Bio-nanocomposite


Storage modulus for PBAT and its Bio-nanocomposite

It is evident that storage modulus of PBAT biopolymer increases with incorporation of nanofiller which is probably due to the efficient stress transfer from the filler to matrix. Further the grafted sample exhibited improved modulus as compared with the ungrafted nanocomposite hybrids. This further confirms improved interface between the nanofiller and the biopolymer matrix upon functionalisation with MA. MA-g-PBAT/B109 sample exhibited optimum storage modulus as compared with MA-g-PBAT/C30B nanocomposite hybrid, which is probably due to better exfoliated structure. In all the samples storage modulus (E’) decreases with the increase in temperature and there is a drastic fall in the modulus beyond –20°C, which possibly corresponds to Tg of the Biopolymer. However in case of the nanocomposite hybrid the rate of fall of matrix modulus has been compensated by the interactions caused due to the presence of the nanoclays in the system which further shows an increase in the thermal stability of biopolymer with the addition of layered silicate.


FTIR- Project1

4.3. Fourier transformation infrared spectroscopy (FTIR)

FTIR spectra of PBAT biopolymer is depicted in figure 3.

Figure 3: FTIR analysis for PBAT and its Bio-nanocomposite; (a). MA-g-PBAT-C20A, (b). MA-g-PBAT-C30B, (c). MA-g-PBAT-B109


It is evident that the peaks around 3000 cm-1 represent C-H stretching corresponding to aliphatic and aromatic portion. The carbonyl groups (>C=O) in ester linkage presented a strong peak around 1710 cm-1 with a sharp peak representing four or more adjacent –CH2- groups at 720 cm-1. The C-O bond in the ester linkage was observed around 1267 cm-1. Bending peaks of benzene substitute were located at 700 cm-1 and 900 cm-1 respectively. The bio-nanocomposite hybrids exhibited similar stretching peaks of PBAT backbone.

In case of MA-g-PBAT/C30B nanocomposites hybrid, spectral band corresponding to 1727 cm1 is probably due >C=O stretching whereas the band at 2995 cm-1 represents the carboxylic-OH stretching. This confirms the formation of carboxylic group due to chemical reaction between PBAT, MA and C30B in presence of a free radical initiator, (BPO).

Similar stretching peaks corresponding to formation of carboxylic group was also observed in MA-g-PBAT/B109 and MA-g-PBAT/C20A at 2997 cm-1 and 2990 cm-1 respectively.


Transmission Electron Microscope - Polymer1

4.2. Transmission Electron Microscope (TEM)

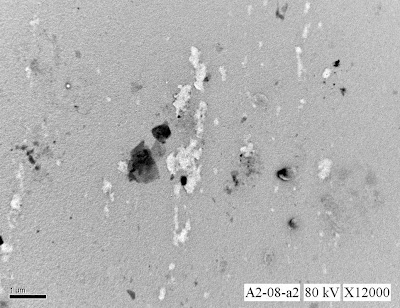
The dispersion characteristics of organically modified clays within the PBAT and MA-g-PBAT matrix is represented in figure 2a to 2e.

Figure 2: TEM Images for PBAT and its Bio-nanocomposite
TEM Images for PBAT(a). PBAT/C30B
TEM Images for PBAT(b). PBAT/B109

TEM Images for PBAT
(c). PBAT/C20ATEM Images for PBAT(d). MA-g-PBAT-C30B


TEM Images for PBAT(e). MA-g-PBAT-B109


The intercalated clay galleries as well as stacks of agglomerated clays galleries were noticed within the PBAT matrix in case of PBAT/C20A (figure 2c), PBAT/B109 (figure2b) and PBAT/C30B (figure 2a) bio-nanocomposites. However, grafting of PBAT with MA results in improved dispersion characteristics of organically modified clays within MA-g-PBAT matrix. In case of MA-g-PBAT/B109 (figure 2e) bio-nanocomposite hybrids, smaller amount of stack platelets appear in broad and obscure regions, since the layer silicates are composed of heavier elements like aluminium, silicon, magnesium than surrounding matrix, they appear darker in bright field images. Regions of exfoliated clay galleries along with intercalated stacks were also evidenced in the TEM micrographs of MA-g-PBAT/C30B (figure 2d) and MA-g-PBAT/B109, which further confirmed improved interface due to formation of chemical/physical bonds.


Tuesday, August 26, 2008

Morphological Analysis - Project1

4. Morphological Analysis

4.1. Wide angle X-Ray Diffraction (WAXD)

The distance between the silicate galleries in the nanoclays has been studied using WAXD measurement in the range of 2q = 1 to 10°. The X-Ray patterns of Na+MMT and organically modified layered silicate C20A, C30B, B109 are depicted in figure 1a.

Figure 1a: WAXD analysis of nanoclays; (a). Na+MMT, (b). C20A, (c). C30B,

(d). B109


WAXD analysis of nanoclays

It is evident that the interlayer distance of d001 plane of Na+MMT increases with organic modification and varies in the following order: B109>C20A>C30B>Na+MMT. The d001 spacing was calculated from the peak position using Bragg’s law [23], nl = 2dsinq, where l = 1.54Å is the X-ray wavelength and tabulated in table 4.

Na+MMT exhibits a diffraction peak at 2q =8.025° corresponding to d001 spacing of 1.1 nm. However modified clays C20A, C30B and B109 reveals a diffraction peak around 4.00, 5.610 and 3.1750 with spacing of 2.209, 1.574 and 3.005 nm respectively. This confirms intercalation of clay layers with organic modification.

The bio-nanocomposite structure has also been characterized using WAXD patterns. Direct evidence of intercalation of polymer chains into the silicate clay galleries has been observed within the experimental range of 2q = 1 to 10°. Figure 1b shows the X-ray diffractogram of PBAT/Na+MMT nanocomposite with 3wt% of clay loading.

Figure 1b: WAXD analysis for bio-nanocomposites; (a). PBAT/C20A, (b). PBAT/C30B, (c). PBAT/B109, (d). MA-g-PBAT-C30B, (e). MA-g-PBAT-B109

WAXD analysis for bio-nanocomposites

It is observed that the intensity characteristic peak of Na+MMT in PBAT/Na+MMT nanocomposite shows similar angle of diffraction as that of pristine clay, which clearly indicates the confirmation of formation of a conventional composite, because there is no favorable interactions of PBAT matrix with Na+MMT. However, XRD patterns of PBAT/C20A, PBAT/C30B and PBAT/B109 bio-nanocomposite hybrids reveal a characteristic peaks, shifted to smaller diffraction angles at 2.175, 2.145 and 2.03° respectively due to intercalation of PBAT chains into the silicate galleries. The interlamellar d001-spacing follows the following order B109 (nm)> C20A (nm)> C30B (nm). This further, shows highly intercalated structure, due to strong interaction between carbonyl groups (>C=O) of PBAT with -OH groups of organoclay.

Further, the average number of clay layers forming tactoids has been calculated using Scherrer equation as


L = Kλ / β001 cosq


Where, L is average thickness clay stack, β001 (radian) is full width at half maximum for 001 reflection, and k = 0.9.

The number of clay layers per stack (N) was calculated as

N = (L/d001) + 1

Test results reported in table 4 indicates that in case of PBAT bio-nanocomposites, N was found to 1.56 – 4.58.This indicates that the clay stacks consisting of 2 – 5 platelets are dispersed in PBAT bio-nanocomposites. In case of MA-g-PBAT/30B and MA-g-PBAT/B109 bio-nanocomposite hybrids, the X-ray diffraction patterns indicate absence of deflection peak within the experimental range, which indicate exfoliation of clay galleries. This is due to the fact that MA acts as a compatibilizing reagent which penetrates into clay galleries forming chemical linkage between the anhydride group of MA and PBAT and layered silicates. The same has been also corroborated using FTIR spectroscopy. This further results in an increase in the gallery spacing allowing the polymer chains to enter and break the galleries during compounding resulting in exfoliated and improved dispersion.